


Website Is Slow but CPU and Memory Are Low: Where Should You Investigate First?
A practical guide to diagnosing slow websites with low CPU and memory by analysing TTFB, databases, pools, networks, storage, caches, external APIs, and frontend performance.
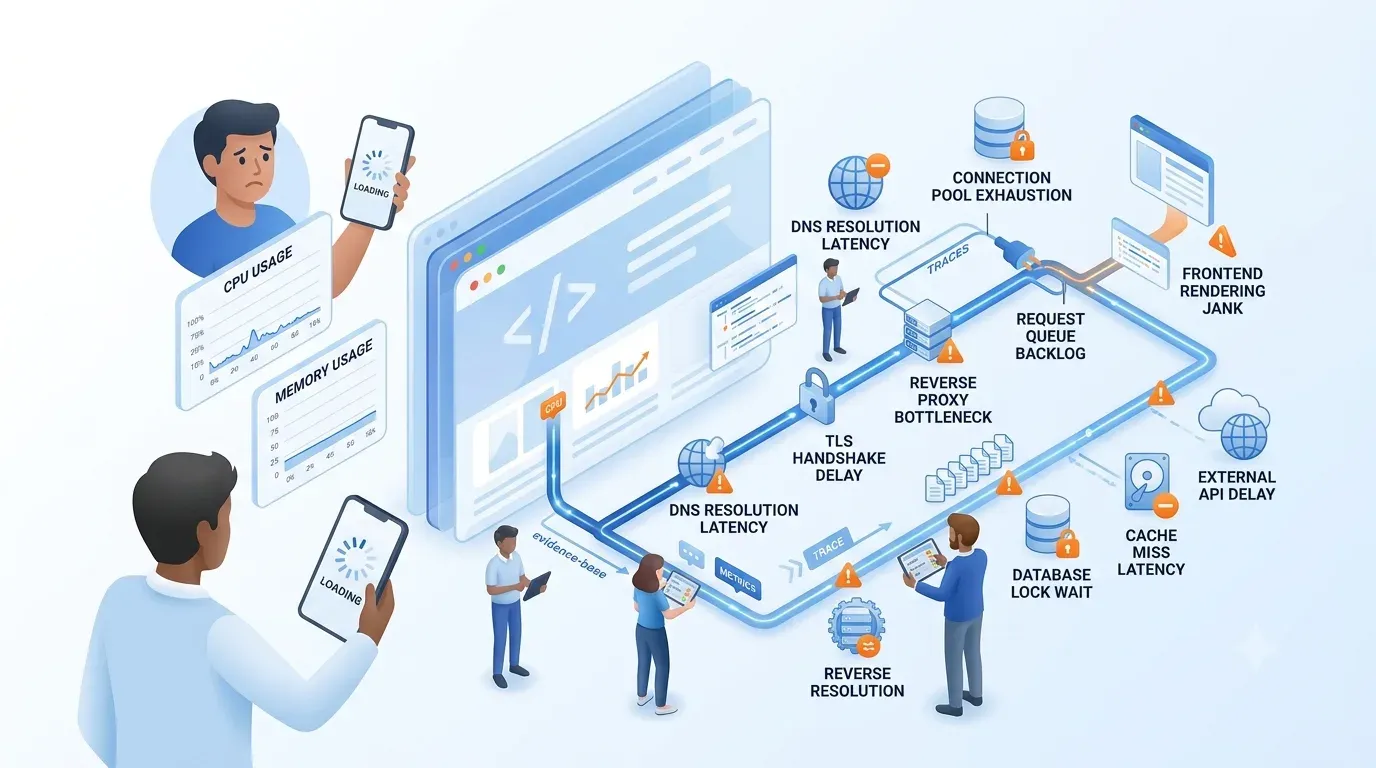
A website that responds slowly while server CPU and memory stay low is a common situation. It does not mean the system is healthy: the bottleneck may be the database, network, storage, connection pool, locks, an external API, DNS, TLS, or the frontend.
A common mistake is adding CPU or memory before knowing where requests are waiting. The right investigation breaks latency down from the browser to the backend, its dependencies, and the data layer.
Core principle
Low CPU and memory do not prove the system is healthy. Measure waiting time at each hop, queue, and dependency before scaling infrastructure.
Investigation
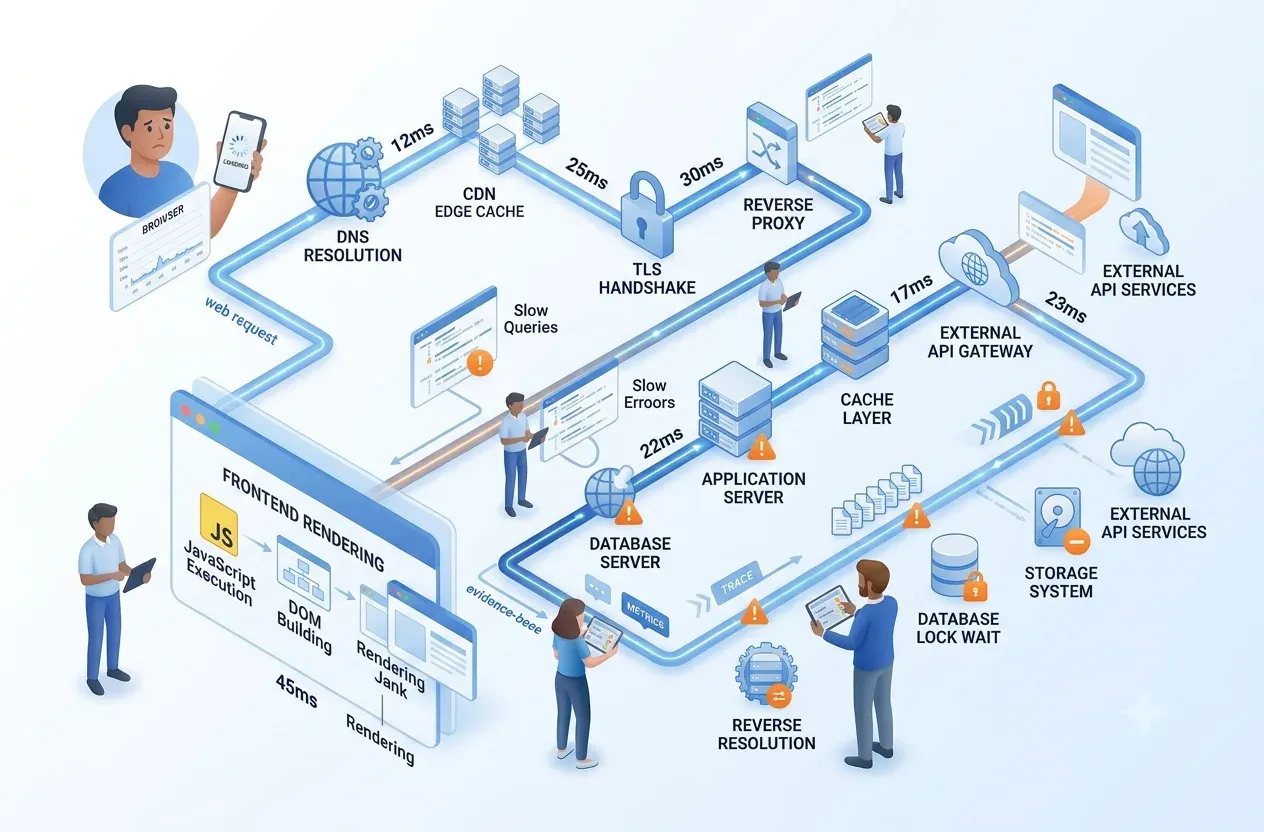
Is the slowness in the frontend or the backend?
Browser timing separates DNS, TCP, TLS, TTFB, download, and rendering.
If TTFB is high, the problem usually sits in the backend or a dependency. If TTFB is low but the page is still slow, investigate JavaScript, images, fonts, hydration, and main-thread work.
Classification
Signals to record
Practical checks for identifying and confirming the real bottleneck.
High TTFB
Measure this signal with metrics, traces, logs, and a reproducible request.
Slow DNS
Measure this signal with metrics, traces, logs, and a reproducible request.
Slow TLS
Measure this signal with metrics, traces, logs, and a reproducible request.
Slow download
Measure this signal with metrics, traces, logs, and a reproducible request.
Long JavaScript execution
Measure this signal with metrics, traces, logs, and a reproducible request.
Region-specific slowness
Measure this signal with metrics, traces, logs, and a reproducible request.
Investigation
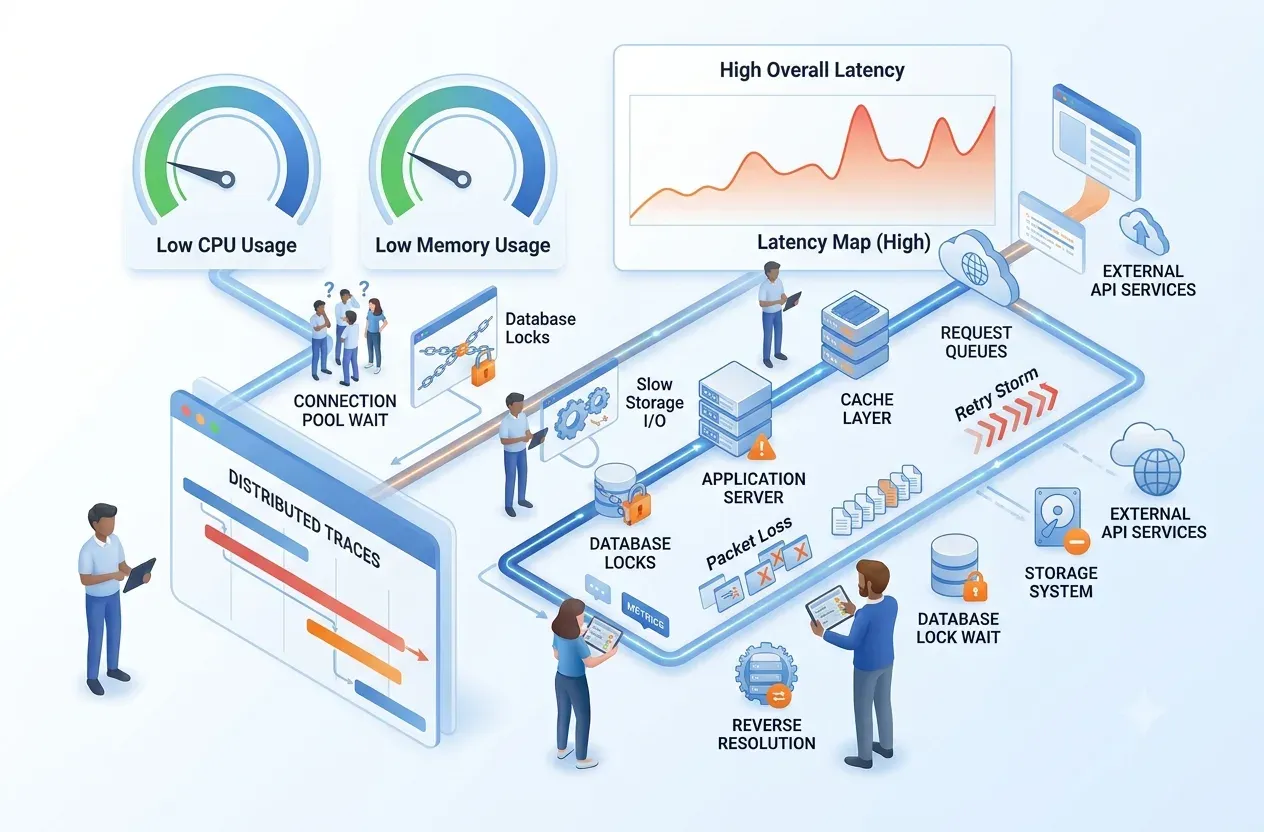
Requests can queue while the CPU is idle
Pools, worker limits, and locks create waiting time without using much CPU.
An application may spend most of its time waiting on the database, file storage, a queue, or an external API. When the connection pool or worker pool is small, requests queue while CPU stays low.
Backend checks
Points to check
Practical checks for identifying and confirming the real bottleneck.
Worker saturation
Measure this signal with metrics, traces, logs, and a reproducible request.
Connection pool
Measure this signal with metrics, traces, logs, and a reproducible request.
Event-loop lag
Measure this signal with metrics, traces, logs, and a reproducible request.
Lock contention
Measure this signal with metrics, traces, logs, and a reproducible request.
Request backlog
Measure this signal with metrics, traces, logs, and a reproducible request.
Retry
Measure this signal with metrics, traces, logs, and a reproducible request.
Investigation
The database is often the main bottleneck
Queries, locks, pools, and I/O can be slow even when database CPU is low.
Database diagnostics
Priority checks
Practical checks for identifying and confirming the real bottleneck.
Slow query
Measure this signal with metrics, traces, logs, and a reproducible request.
Lock wait
Measure this signal with metrics, traces, logs, and a reproducible request.
Pool saturation
Measure this signal with metrics, traces, logs, and a reproducible request.
N+1 query
Measure this signal with metrics, traces, logs, and a reproducible request.
Missing index
Measure this signal with metrics, traces, logs, and a reproducible request.
I/O wait
Measure this signal with metrics, traces, logs, and a reproducible request.
Replica lag
Measure this signal with metrics, traces, logs, and a reproducible request.
Investigation
Slow I/O or network does not raise CPU
Disk latency, packet loss, and cross-region calls can stretch requests.
Check disk queue, read/write latency, IOPS, throughput, fsync time, packet loss, TCP connect, TLS handshake, and the number of hops through proxies or a service mesh.
Infrastructure checks
Common signs
Practical checks for identifying and confirming the real bottleneck.
High disk await
Measure this signal with metrics, traces, logs, and a reproducible request.
IOPS ceiling
Measure this signal with metrics, traces, logs, and a reproducible request.
Packet loss
Measure this signal with metrics, traces, logs, and a reproducible request.
Cross-region call
Measure this signal with metrics, traces, logs, and a reproducible request.
Proxy chain
Measure this signal with metrics, traces, logs, and a reproducible request.
Log pressure
Measure this signal with metrics, traces, logs, and a reproducible request.
Investigation
External dependencies can dominate response time
Internal CPU stays low because the application is waiting on another system.
Payment, email, authentication, AI APIs, and other SaaS calls need timeouts, circuit breakers, caching, and fallbacks. Caches also need monitoring for hit ratio, hot keys, stampedes, and TTL.
Dependency checks
Questions to answer
Practical checks for identifying and confirming the real bottleneck.
P95 and P99
Measure this signal with metrics, traces, logs, and a reproducible request.
Timeout
Measure this signal with metrics, traces, logs, and a reproducible request.
Retry policy
Measure this signal with metrics, traces, logs, and a reproducible request.
Sequential calls
Measure this signal with metrics, traces, logs, and a reproducible request.
Cache hit ratio
Measure this signal with metrics, traces, logs, and a reproducible request.
Fallback
Measure this signal with metrics, traces, logs, and a reproducible request.
Investigation
A fast backend can still feel slow to users
Low server CPU says nothing about the CPU on the user's device.
If TTFB is good but LCP or INP is poor, look at the JavaScript bundle, hydration, third-party scripts, images, fonts, and the render waterfall.
Frontend checks
Common issues
Practical checks for identifying and confirming the real bottleneck.
Large bundle
Measure this signal with metrics, traces, logs, and a reproducible request.
Hydration cost
Measure this signal with metrics, traces, logs, and a reproducible request.
Unoptimised images
Measure this signal with metrics, traces, logs, and a reproducible request.
Third-party script
Measure this signal with metrics, traces, logs, and a reproducible request.
Font loading
Measure this signal with metrics, traces, logs, and a reproducible request.
Render waterfall
Measure this signal with metrics, traces, logs, and a reproducible request.
Investigation
Without tracing it is hard to see where a request is slow
Aggregated infrastructure metrics are not enough.
Signals
Minimum observability set
Practical checks for identifying and confirming the real bottleneck.
Distributed tracing
Measure this signal with metrics, traces, logs, and a reproducible request.
RED metrics
Measure this signal with metrics, traces, logs, and a reproducible request.
Database metrics
Measure this signal with metrics, traces, logs, and a reproducible request.
Infrastructure metrics
Measure this signal with metrics, traces, logs, and a reproducible request.
Correlated logs
Measure this signal with metrics, traces, logs, and a reproducible request.
Deployment markers
Measure this signal with metrics, traces, logs, and a reproducible request.
Investigation
Where should the investigation start?
Move from symptom to evidence instead of optimising by intuition.
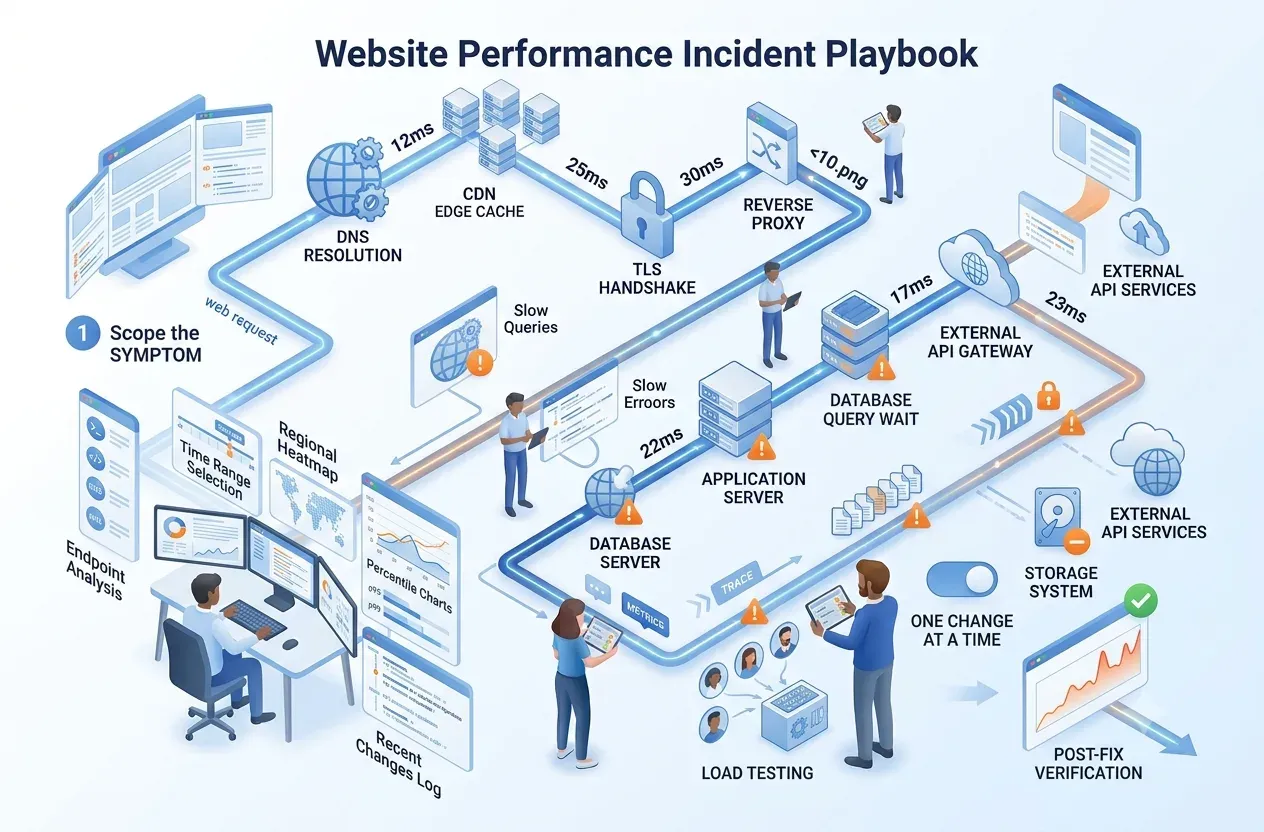
Step 1
Narrow down the symptom
Practical checks for identifying and confirming the real bottleneck.
Endpoint
Measure this signal with metrics, traces, logs, and a reproducible request.
Time window
Measure this signal with metrics, traces, logs, and a reproducible request.
Region
Measure this signal with metrics, traces, logs, and a reproducible request.
Percentile
Measure this signal with metrics, traces, logs, and a reproducible request.
Recent change
Measure this signal with metrics, traces, logs, and a reproducible request.
Step 2
Break down latency
Practical checks for identifying and confirming the real bottleneck.
Browser timing
Measure this signal with metrics, traces, logs, and a reproducible request.
Proxy timing
Measure this signal with metrics, traces, logs, and a reproducible request.
Application spans
Measure this signal with metrics, traces, logs, and a reproducible request.
Database spans
Measure this signal with metrics, traces, logs, and a reproducible request.
External calls
Measure this signal with metrics, traces, logs, and a reproducible request.
Step 3
Confirm the bottleneck
Practical checks for identifying and confirming the real bottleneck.
Reproduce
Measure this signal with metrics, traces, logs, and a reproducible request.
Compare
Measure this signal with metrics, traces, logs, and a reproducible request.
Controlled load test
Measure this signal with metrics, traces, logs, and a reproducible request.
Change one thing
Measure this signal with metrics, traces, logs, and a reproducible request.
Verify
Measure this signal with metrics, traces, logs, and a reproducible request.
Investigation
Fixes that usually do not work
Optimising the wrong place makes the system more complex.
Anti-patterns
Mistakes to avoid
Practical checks for identifying and confirming the real bottleneck.
Adding CPU first
Measure this signal with metrics, traces, logs, and a reproducible request.
Only looking at averages
Measure this signal with metrics, traces, logs, and a reproducible request.
Not separating frontend and backend
Measure this signal with metrics, traces, logs, and a reproducible request.
Ignoring pools and queues
Measure this signal with metrics, traces, logs, and a reproducible request.
No tracing
Measure this signal with metrics, traces, logs, and a reproducible request.
Changing many things at once
Measure this signal with metrics, traces, logs, and a reproducible request.
Investigation
How FlowNexa helps investigate website performance
Find the real bottleneck before scaling infrastructure.
Services
Support scope
Practical checks for identifying and confirming the real bottleneck.
Performance Assessment
Measure this signal with metrics, traces, logs, and a reproducible request.
Observability Setup
Measure this signal with metrics, traces, logs, and a reproducible request.
Database Review
Measure this signal with metrics, traces, logs, and a reproducible request.
Load Testing
Measure this signal with metrics, traces, logs, and a reproducible request.
Infrastructure Review
Measure this signal with metrics, traces, logs, and a reproducible request.
Remediation
Measure this signal with metrics, traces, logs, and a reproducible request.
FlowNexa's view
Low CPU and memory do not prove the system is healthy. Measure waiting time at each hop, queue, and dependency before scaling infrastructure.
Investigation
Frequently asked questions
Answers focused on practical investigation steps.
FAQ
Quick answers
Practical checks for identifying and confirming the real bottleneck.
Does low CPU mean no overload?
Measure this signal with metrics, traces, logs, and a reproducible request.
What to check first?
Measure this signal with metrics, traces, logs, and a reproducible request.
Low database CPU but slow queries?
Measure this signal with metrics, traces, logs, and a reproducible request.
Should we add servers right away?
Measure this signal with metrics, traces, logs, and a reproducible request.
Which metrics matter?
Measure this signal with metrics, traces, logs, and a reproducible request.
Can FlowNexa investigate production?
Measure this signal with metrics, traces, logs, and a reproducible request.
FlowNexa Performance & Observability
Find the bottleneck before adding infrastructure
Practical checks for identifying and confirming the real bottleneck.
Book a performance consultation
Measure this signal with metrics, traces, logs, and a reproducible request.
Request a Performance Assessment
Measure this signal with metrics, traces, logs, and a reproducible request.
