



Workflow now takes 30 minutes: find the bottleneck
A practical runbook for diagnosing a slow n8n workflow using queue wait, node duration, API latency, workload size, database behavior, CPU, and memory.


When a workflow that used to finish in 5 minutes now takes 30, do not start by adding CPU or workers. First locate where the extra 25 minutes went: queue delay, a slower external API, more items, retries or rate limits, execution-data writes, database latency, or CPU and memory saturation. Optimize only after identifying the stage that created the regression.
The fastest investigation compares a slow execution with a healthy one carrying a similar workload, separates queue wait from execution runtime, ranks nodes by duration change, and correlates timing with item count, payload size, HTTP retries, and infrastructure metrics. If only one workflow is slow, investigate its nodes and dependencies first. If many workflows degrade together, prioritize workers, queues, the database, and shared infrastructure. Treat this as regression analysis, not configuration guesswork.
Scope
First determine whether the 30 minutes are execution or waiting
End-to-end latency and node processing time are different measurements.
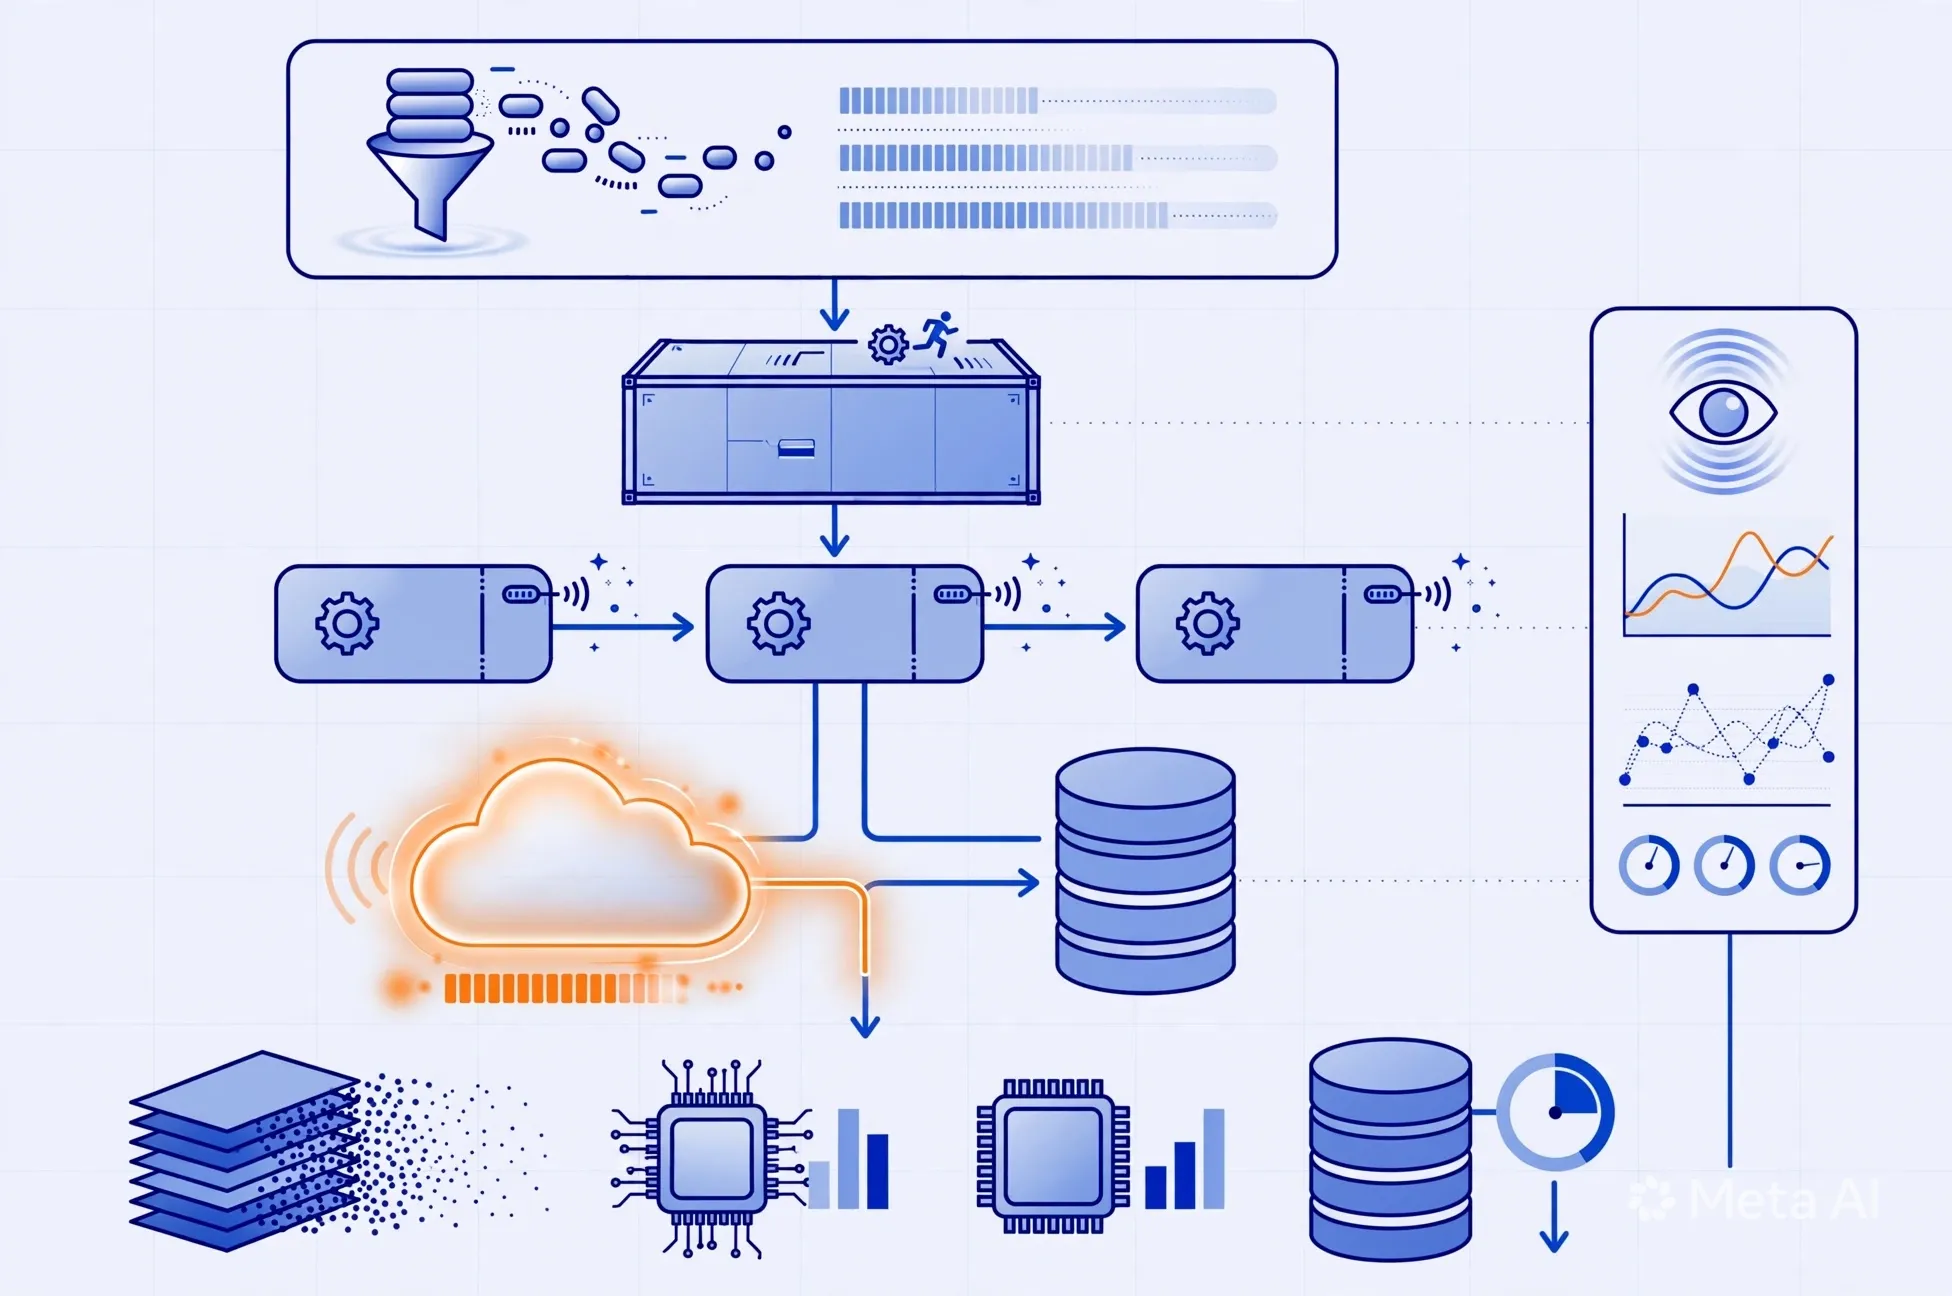
Capture at least four timestamps: trigger arrival, execution creation, worker start, and completion. In queue mode, n8n sends production executions to workers through a queue. A job can therefore arrive on time but start late because of backlog, unavailable workers, or low concurrency. Optimizing a node will not remove a delay that occurred before the execution began.
Create two metrics: queue_wait_seconds = worker_started_at - queued_at and run_seconds = finished_at - worker_started_at. If those timestamps are not yet available, reconstruct them from execution history, worker logs, and existing metrics. Examine p50, p95, and p99 rather than one run. A single 30-minute outlier is a different incident from p95 steadily moving from 5 to 30 minutes.
Baseline
Compare equivalent executions before declaring a regression
The same workflow can still process a different workload, branch, or dependency.
Select a recent healthy execution and a slow one with the same workflow version, trigger type, business branch, and comparable input size. Compare item_count, API page count, JSON or binary size, loop iterations, downstream request count, retry count, and per-node duration. If the input grew substantially, the workflow may not have regressed; the workload changed.
Build a parallel change timeline covering the n8n or node version, workflow activation, credentials, endpoints, database indexes, worker replicas and concurrency, CPU-memory limits, execution-data retention, and traffic schedules. Include provider-side changes: an API may become slower, introduce rate limits, or switch to pagination. Find the first change aligned with the latency increase, then test causality rather than assuming correlation is enough.
Minimum evidence
Build an evidence pack before changing configuration
A compact, consistent dataset prevents intuition-led optimization.
Execution pair
One healthy and one slow run with comparable workloads.
Timing
Queue wait, total runtime, and duration by node or stage.
Workload
Item count, payload or binary size, page count, and actual request volume.
Dependency
HTTP status, latency, rate-limit headers, timeout, and retry attempts.
Infrastructure
CPU throttling, memory and GC, worker concurrency, queue depth, and DB latency.
Change timeline
Deployments, configuration, traffic, and dependency changes around the incident.
Node timing
Rank nodes by added time, not only absolute duration
The slowest node is not necessarily the node responsible for the regression.
For each node, calculate delta = slow_duration - baseline_duration, then sort descending. A node that always takes 90 seconds but did not change cannot explain the new 25 minutes. A node that moved from 20 seconds to 12 minutes can. For loops or per-item processing, add duration_per_item and invocation count to separate slower logic from increased fan-out.
n8n can emit OpenTelemetry traces for workflow and node executions, which supports latency monitoring and execution-path debugging. Without tracing, add temporary stage timestamps and correlation IDs, but avoid logging complete sensitive payloads. Preserve one executionId or correlationId across HTTP calls, sub-workflows, and database operations so their timelines can be joined. The desired output is a waterfall that accounts for the 30 minutes, not merely a “workflow completed” log line.
External wait
API latency, rate limits, and retries can hide inside one simple node
One HTTP node may contain repeated waits, pagination, and backoff.
Measure every request, not just the HTTP node's aggregate duration. Record endpoint, status class, timeout, retry attempt, Retry-After when present, page count, and response size. With 429, 5xx, or timeouts, exponential backoff can turn minutes into tens of minutes while the workflow still succeeds. If the API runs sequentially per item, total time approaches item_count × latency_per_request; a rise in either factor expands runtime.
Before increasing parallelism, verify the provider quota and destination idempotency. More concurrent calls can reduce latency but can also create more 429 responses, duplicate side effects, or load on a partner database. Prefer batch APIs where available, cache slowly changing data, retry only transient failures, use finite timeouts, and record attempt counts. For fan-out, use bounded concurrency rather than maximum parallelism.

Queue & workers
If many workflows slow down together, inspect queues and workers first
Backlog, concurrency, and constrained resources can raise latency without changing node logic.
In queue mode, inspect waiting and active jobs, the oldest job age, completion throughput, online workers, and effective concurrency. n8n lets operators control how many jobs a worker processes concurrently. Too low creates backlog; too high can saturate CPU, memory, the database, or downstream services. Adding workers is useful when queue wait is high and shared dependencies still have spare capacity.
On Kubernetes, inspect CPU throttling rather than CPU usage alone; correlate memory working set, OOMs or restarts, event-loop lag where available, and garbage-collection time. A pod at 70% CPU usage can still be throttled when its limit is too tight for bursts. Check whether worker replicas receive jobs evenly. If queue wait is near zero but execution runtime is high, more workers generally will not make one execution faster; optimize its internal stages or partition work safely.
Data & database
Execution history and growing payloads can make workflows slower over time
A healthy database on day one may behave differently after millions of executions.
Correlate query time, connection-pool wait, database CPU and IO, slow queries, table or index growth, and execution-state write time. n8n supports configuring which execution data is saved and pruning it by age or count. Retaining every successful run with large payloads indefinitely can increase storage and query cost, but change retention only after reviewing audit, debugging, and compliance requirements.
Within the workflow, look for nodes that retain the entire dataset at every step, merge large arrays, encode binary data into JSON, or return unnecessary data across sub-workflows. n8n notes that high data volume, binary data, many nodes, and Code nodes can contribute to memory pressure. Remove fields early, paginate or batch, use appropriate binary storage, and return minimum outputs. Do not mask unbounded data growth by increasing heap alone.
Runbook
A 30–60 minute bottleneck investigation runbook
Move from low-risk measurement to controlled experiments.
Minutes 0–10: confirm scope, choose comparable healthy and slow executions, and separate queue wait from runtime. 10–20: build a table of node duration, delta, item count, and attempt count; identify the top three contributors. 20–35: inspect each top dependency — API latency, status and rate limits; database query or pool wait; or CPU, memory, and throttling. 35–45: align deployment, configuration, and traffic timelines and form one falsifiable hypothesis.
Minutes 45–60: test one small change in staging or on limited traffic: reduce batch size, remove unintended retry, add a validated index, add one worker, or bound concurrency. Change one variable at a time and compare the same workload. If the cause remains unclear, increase node-level tracing and correlation rather than continuing to tune resources. In production, keep a rollback path and never replay side-effecting executions without idempotency.
FAQ
Should I immediately add CPU or memory when a workflow slows down?
Not without evidence of CPU throttling, memory pressure, or related GC. Extra resources may not help when time is spent in a queue or external API.
How do I know whether the queue causes the delay?
Compare when a job entered the queue with when a worker started it. High queue wait with normal node duration points toward backlog, capacity, or concurrency.
What should I do when the HTTP Request node dominates runtime?
Measure individual requests, pages, status codes, timeouts, and retries. Then evaluate batching, caching, timeout, retry policy, and bounded concurrency against provider limits.
Will splitting into sub-workflows make it faster?
Not automatically. Sub-workflows improve boundaries and operations; they improve speed only when the new design reduces data, removes duplicate work, or enables safe parallelism.
When is the incident actually resolved?
When end-to-end p95 meets the SLO under representative workload, queue wait remains stable, errors and retries do not rise, and business results are neither missing nor duplicated.
FlowNexa
Optimize workflows with evidence, not guesswork
If an n8n workflow is becoming slower or its bottleneck is unclear, FlowNexa can help establish baselines, tracing, and a rollback-ready optimization plan.
Performance baseline
Establish queue wait, node latency, throughput, and workload profiles.
Bottleneck review
Use evidence to isolate APIs, data, databases, workers, concurrency, and infrastructure.
Safe optimization
Test one variable at a time, remeasure p95, and preserve rollback and idempotency.


